Wednesday, February 20, 2013

How does MDX Query run


When user fires a MDX query it goes through sequence of steps


1.      Formula Engine: Formula engine receives the MDX first hand and then parses it. Once MDX is correctly parsed it looks for data in its Cache, if find all the data it needs, it will skip Storage engine(step 2) and goes to Step 3


2.      Storage Engine: Formula engine sends request to Storage engine for data. Storage engine looks into its Cache and if doesn’t fine requested data if fetches data from physical storage and returns back to Formula engine


3.      Formual Engine: Once it get all the Data it needs, performs calculations specified in MDX and return result set to MDX editor.


Form above Steps we can see the there could be two bottleneck for a MDX query

a)    Data Fetch from Storage engine

b)    Performing Calculation


So How do we know where it is stuck.


User profile and run MDX in background. Now check for Query Subcube and Query Subcube Verbose Event in profiler, when u sum the time from these events corresponding to the Query you will get the Time taken by Storage Engine to return the Data. Now if you subtract this time from Total time taken by Query you will get time taken in performing Calculation. 


There we are we know the time taken at each step and choose the direction to look for.

Cheers!!


Tuesday, July 10, 2012

Using Excel 2007 ( xlsx) in SSIS or exporting more than 65536 row in ssis

Very common scenario when there is a need to export a table having more than 65536 rows to EXCEL.  Best solution to this is use Excel 2007 (.xlsx). But the problem SSIS Excel Source or Destination does not provide support for it.

We can still connect to Excel 2007 using SSIS and export/import data.
HOW..lets see in an example

I have have table having 70,000 rows and we will pump this to an Excel file

1. The table

2. The Excel work:

Create an OleDb connection to Excel in Connection Manager
a. Use Microsoft Office 12.0 Access Database Provider from Provider list
b. Give Path to the xlsx file in Server or File name


c. Go to the ALL tab and give Excel 12.0 as Extended Property

3. Now use OleDB Destination (careful we are using Excel Destination here) and give Excel Connection Mgr, select the Sheet name, Map the columns and there it is.
4. Run


Monday, May 28, 2012

SSAS: Memory error

Memory error: The operation cannot be completed because the memory quota estimate (XXXXMB) exceeds the available system memory (XXXXMB).

SSAS throws this error while processing one of the dimension in Cube when memory need for the operation exceeds memory available for SSAS, primarily due to size of dimension.


To solve this error there are three options

A)  Increase size of RAM. (I know, not easy to implement in most organizations, so we go to next option)

B)  Divide you Dimension table so as they are small enough to complete processing in given memory.
for example if Dimension is holding Customer Names then divide DimCustomer into two table, one with Customer names starting with A-M and another with N-Z. It will require updation of fact table with new Customer Primary key.

(Again will require time and design changes may not be possible straight away, so we go to next option)

C)  BufferMemoryLimit: There is always an easy fix but not permanent so as our next option.

For Processing requirement by default SSAS provides 60% of memory available to it. For a fix we can increase Buffer Memoryt Limit  percentage so as to accommodate the processing requirement.

It is specified in msmdsrv.ini file in Program Files/SQL Sever/.../SSAS/Config/ folder at


You can increase this BufferMemoryLimit to you suitability.
a) Between 0-100, it is in Percentage and allocated % of Memory to the operations
b) Above 100, it is in MB and allocates specified Memory to the operation

As I said it is a quick fix and should be treated as quick fix only and you may need to test if it is affecting other operations performance.


--Happy Processing!!

Thursday, October 20, 2011

Numeric gets converted to Text in Excel from SSIS

This is with reference to a question asked in MSDN forum where a User was trying to fill an Excel sheet with one the Numeric Column and field was changing to Text. 

OR

SSIS Excel Data Source: Text was truncated or one or more characters had no match in the target code page


This happens as Excel identifies data type for a column based on sampling of top few rows(8 by default) and in that sample it doeskin get correct data type.


 Problem:

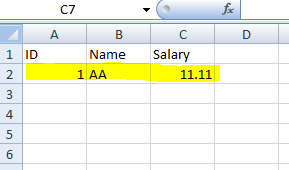
Lets see the problem with an example I have a simple table with following structure
CREATE TABLE Emp
( ID INT IDENTITY (1,1)
, [Name] VARCHAR (10)
, Salary NUMERIC (10,2)
);


Here ID and Salary are Integer and Numeric receptively and if we try to export them to Excel using SSIS, Excel will store the correct values but would convert them into Text as below( see the Green mark over cell)


Unforunatly there is no way that we can control or change  the format/ datatype of a column of Excel sheet form SSIS.Even if we change the datatype using Advance Editor in Excel Destination , it wont reflect the change.

Solution:
So is there is solution to this, well not excatly a solution but a workaround Yes.
When Excel decide about format of cells in a column it takes sample from first few cells (other than first row-header) and keeps the same format for rest of cells down below. We can use this property of Excel and create one dummy row with the format as we are excepting for rest of the cells.

Now during actual writing of data Excel will pick the format from Dummy Row and keep it for rest of them. You can even hide Dummy Row after putting some values in it.

OR

We can increase the sampling Rows for Excel and it can guess Correct Data Type based on given Range of Rows. Sample Range for Rows can be increased from Registry Key TypeGuessRows
 

Path in Registry

HKEY_LOCAL_MACHINE\SOFTWARE\Microsoft\Jet\4.0\Engines\Excel 

For 64 bit machines it may be under
 HKEY_LOCAL_MACHINE\SOFTWARE\Wow6432Node\Microsoft\Jet\4.0\Engines\Excel 

You can set any values to this editable field
a) Default: 8
b) 0 will take all the rows in the Sheet -This may slow down validation if no. of rows are large.
c) Recommend is to give a value where you can be sure of having correct data type rows.


Cheers!!

Tuesday, June 28, 2011

SSRS Interview Questions

Q1. WHAT is SQL Server Reporting Services(SSRS)?
SQL Server Reporting Services is a server-based reporting platform that you can use to create and manage tabular, matrix, graphical, and free-form reports that contain data from relational and multidimensional data sources. The reports that you create can be viewed and managed over a World Wide Web-based connection

Q2. Architecture of SSRS:
 -Admin

Q3. What are the three stages of Enterprise Reporting Life Cycle ?
a. Authoring
b. Management
c. Access and Delivery

Q4. What are the components included in SSRS?
1. A Complete set of Tools that can be used to create, manage and view reports
2. A Report Server component that hosts and processes reports in a variety of formats. Output formats include HTML, PDF, TIFF, Excel, CSV, and more.
3.An API that allows developers to integrate or extend data and report processing in custom applications, or create custom tools to build and manage reports.

Q5. What is the benefit of using embedded code in a report?
1. Reuseability of Code: function created in embedded code to perform a logic can be then used in multiple expressions
2. Centralized code: helps in better manageability of code.


Q6. Which programming language can be used to code embedded functions in SSRS?
Visual Basic .NET Code.

Q7. Important terms used in the reporting services?

1. Report definition:  The blueprint for a report before the report is processed or rendered. A report definition contains information about the query and layout for the report.

2. Report snapshot: A report that contains data captured at a specific point in time. A report snapshot is actually a report definition that contains a dataset instead of query instructions.

3. Rendered report: A fully processed report that contains both data and layout information, in a format suitable for viewing (such as HTML).

4. Parameterized report: A published report that accepts input values through parameters.

5. Shared data source: A predefined, standalone item that contains data source connection information.

6. Shared schedule: A predefined, standalone item that contains schedule information.

7. Report-specific data source: Data source information that is defined within a report definition.

8. Report model: A semantic description of business data, used for ac hoc reports created in Report Builder.

9. Linked report: A report that derives its definition through a link to another report.

10. Report server administrator: This term is used in the documentation to describe a user with elevated privileges who can access all settings and content of a report server. If you are using the default roles, a report server administrator is typically a user who is assigned to both the Content Manager role and the System Administrator role. Local administrators can have elevated permission even if role assignments are not defined for them.

11. Folder hierarchy: A bounded namespace that uniquely identifies all reports, folders, report models, shared data source items, and resources that are stored in and managed by a report server.


12. Report Server: Describes the Report Server component, which provides data and report processing, and report delivery. The Report Server component includes several subcomponents that perform specific functions.

13. Report Manager: Describes the Web application tool used to access and manage the contents of a report server database.

14. Report Builder: Report authoring tool used to create ad hoc reports.

15. Report Designer: Report creation tool included with Reporting Services.

16. Model Designer: Report model creation tool used to build models for ad hoc reporting.

17. Report Server Command Prompt Utilities: Command line utilities that you can use to administer a report server.
a) RsConfig.exe, b) RsKeymgmt.exe, c) Rs.exe

Q8. what are the Command Line Utilities available In Reporting Services?
· Rsconfig Utility (Rsconfig.exe): encrypts and stores connection and account values in the RSReportServer.config file. Encrypted values include report server database connection information and account values used for unattended report processing
· RsKeymgmt Utility: Extracts, restores, creates, and deletes the symmetric key used to protect sensitive report server data against unauthorized access
· RS Utility: this utility is mainly used to automate report server deployment and administration tasks.Processes script you provide in an input file.
 
Q. How to know Report Execution History?
ExecutionLog table in ReportServer database store all the logs from last two months.
 SELECT * FROM ReportServer.dbo.ExecutionLog

-Development
Q. What is difference between Tablular and Matrix report?
OR What are the different styles of reports?

Tablular report: A tabular report is the most basic type of report. Each column corresponds to a column selected from the database.

Matrix report: A matrix (cross-product) report is a cross-tabulation of four groups of data:
    a. One group of data is displayed across the page.
    b. One group of data is displayed down the page.
    c. One group of data is the cross-product, which determines all possible locations where the across and down data relate and places a cell in those locations.
    d. One group of data is displayed as the "filler" of the cells.
Martix reports can be considered more of a  Pivot table.

Q. How to create Drill-through reports?
Using Navigation property of a cell and setting child report and its parameters in it.

Q. How to create Drill-Down reports?
To cut the story short: 
- By grouping data on required fields
-Then toggle visibility based on the grouped filed

Q. How to select ALL from a parameter list?
http://sqlserversolutions.blogspot.com/2011/03/select-all-in-parameter-of-ssrs-report.html  

(Work in progress, more to follow)


Monday, June 06, 2011

Check out Whats happening on the Report Server

Sometime it may happen that Report server may work slow and you  might want to know whats really happening in the server and which reports are in use to get a lead.


1. To know which reports are running on you system is to check ExecutionLog table in ReportServer database of your server.

SELECT * FROM ReportServer.dbo.ExecutionLog

This table contains the history of which report is executed at which time, taking how much time and by whom. This can lead to the report which is taking most time.

But the draw back of this table is that it does not get information about subscription reports. And when I look into any Report Server first thing I look for is Reports Subscriptions. Those are little hidden ones and take work in background with letting anyone who that how much resource and time they are consuming.

2. Next method of knowing whats happening in our Report Server is through Manage Jobs page on ReportServers SiteSettings


This displays and lets user to cancel any In-Progress Report or Subscription. Only limition is that it will display only in-progress reports/subscription which are in-progress for atleast 60 seconds.


Tuesday, May 10, 2011

Data-dump in Dynamic Flat file with todays date

This is with reference to a question asked my an online friend regarding how can we do a daily Datadump on a flat file with a todays date as a file name.

To show that I will use an example in which we will dump a table "Student" from SQL Server database into a file with name appended with todays date and time eg. DataDump_201105101108.txt. 20110510 being the date and 11:08 as time of load.

1. Lets have a look at our table.

2. Now create a simple package with a Data Flow task which dumps data from Student to a flat file let say with Dummy.txt. SSIS is metadata oriented so at the time of creation of package you would need to have a dummy txt file so that mappings can be created.


3. Not the actual work starts. Go the Flat file Connection Managers Properties and expand Expressions.
 Choose ConnectionString as Property.


4. In Expression Builder window create a expression as
"E:\\DataDump_" + (DT_WSTR,4)DatePart("yyyy", GetDate()) + RIGHT("0" + (DT_WSTR,2)DatePart("mm", GetDate()), 2) + RIGHT("0" + (DT_WSTR,2)DatePart("dd", GetDate()), 2) + RIGHT("0" + (DT_WSTR,2)DatePart("hh", GetDate()), 2) + RIGHT("0" + (DT_WSTR,2)DatePart("mi", GetDate()), 2) + ".txt"


5. Run the package it will create a flat file with required File name.


--Cheers

Google Dataset Search

Google's Vision statement  is “ to provide access to the world's information in one click. ” Google’s mission Statement is “ ...